

A study by Chorba et al investigate Deep learning approaches in detect heart murmurs and clinically significant valvular heart disease, using recording from digital stethoscopes.
A deep neural network was trained using 34 hours of previously recorded and annotated heart sounds. 962 participants were then enrolled, and recording collected at 4 primary auscultation locations. Digital algorithm sensitivity was analysed by comparing results to patient echocardiograms and annotations by 3 expert Cardiologists.
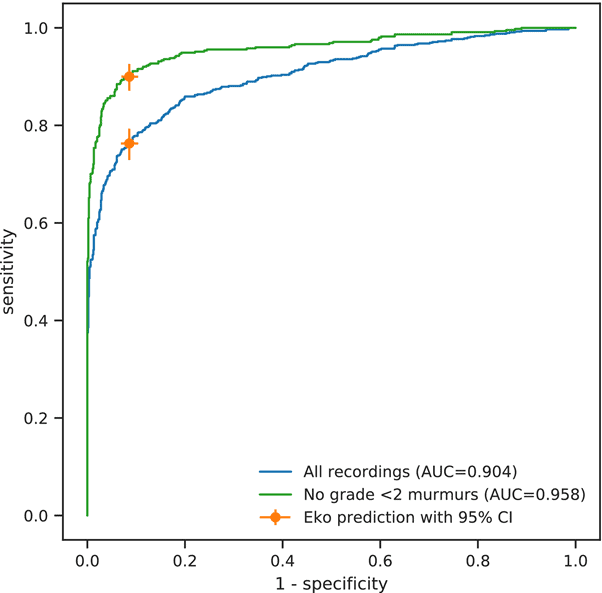
Fig 1 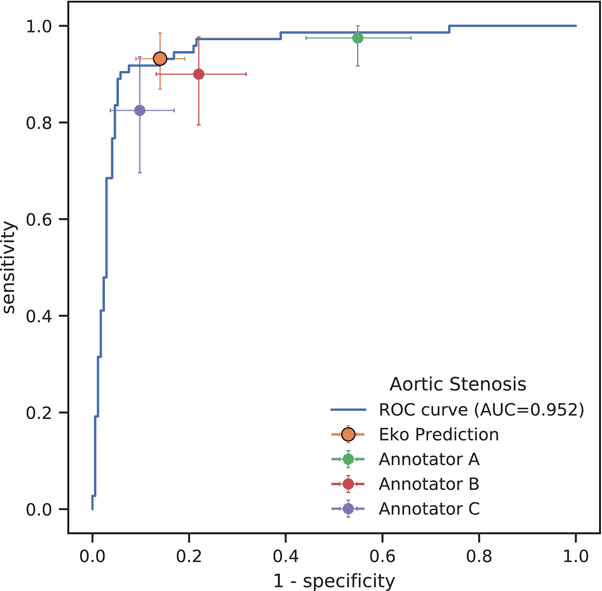
Fig 2 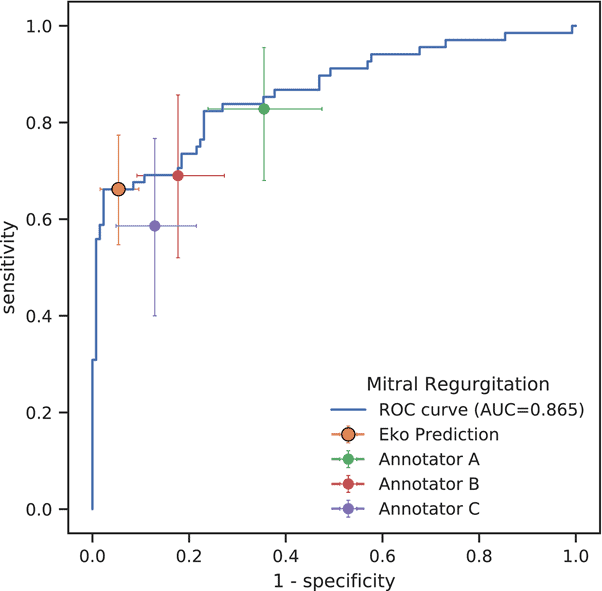
Fig 3
Sensitivity and specificity of the algorithm for detecting murmurs was 76.3% and 91.4%, respectively. By omitting grade 1 intensity murmurs, sensitivity increased to 90.0%. Application of the algorithm at the appropriate anatomic auscultation location detected moderate‐to‐severe or greater aortic stenosis, with sensitivity of 93.2% and specificity of 86.0%, and moderate‐to‐severe or greater mitral regurgitation, with sensitivity of 66.2% and specificity of 94.6%.
The authors state that such algorithms ‘would have utility as front-line clinical support tools to aid clinicians in screening for cardiac murmurs caused by valvular heart disease’.
Figure 1: Performance of murmur detection algorithm.
Receiver operating characteristic curves for all recordings (blue) and following removal of softer, low grade, murmurs (green) are shown. Eko software operates with parameters yielding the orange marker. Error bars indicate 95% CIs. AUC = area under the curve.
Figure 2: Performance of aortic stenosis screening by murmur detection algorithm.
The algorithm receiver operating characteristic (ROC) curve is shown in blue. Eko software operates at the orange marker. The performance of the individual cardiologists on the annotated subset of the overall data set is shown by the green, red, and purple markers. Error bars indicate 95% CIs. AUC = area under the curve.
Figure 3: Performance of mitral regurgitation screening by murmur detection algorithm.
The algorithm receiver operating characteristic (ROC) curve is shown in blue. Eko software operates at the orange marker. The performance of the individual cardiologists on the annotated subset of the overall data set is shown by the green, red, and purple markers. Error bars indicate 95% CIs. AUC = area under the curve.
More here: Deep Learning Algorithm for Automated Cardiac Murmur Detection via a Digital Stethoscope Platform | Journal of the American Heart Association (ahajournals.org)
Chorba, J.S., Shapiro, A.M., Le, L., Maidens, J., Prince, J., Pham, S., Kanzawa, M.M., Barbosa, D.N., Currie, C., Brooks, C. and White, B.E., 2020. Deep Learning Algorithm for Automated Cardiac Murmur Detection via a Digital Stethoscope Platform. Journal of the American Heart Association, p.e019905.