

By Ahmed El-Medany
A meta-analysis by Huang et al has suggests exposure to short- and long-term air pollution in childhood and adolescence increases the likelihood of hypertension later in life.14 studies (351,766 participants) were analysed, with a mean age of 5.4-12.7 years. studies were divided into groups by composition of air pollutants (NO2, particulate matter (PM) with diameter ≤10 μm or ≤2.5 μm) and length of exposure. The beta regression coefficients (β) and their 95% confidence intervals (Cis) were calculated to evaluate the strength of the effect with each 10 μg/m3 increase in air pollutants.
Researchers observed a significant association between short-term exposure to PM10 and elevated systolic blood pressure (BP) values (β = 0.267; 95% CI, 0.033-0.501) with every 10 g/m3 increase. Long-term exposure to PM2.5 (β = 1.809; 95% CI, 0.962-2.655), PM10 (β = 0.526; 95% CI, 0.095-0.958) and nitrogen dioxide (β = 0.754; 95% CI, 0.541-0.968) were all associated with elevated systolic BP.
Long-term PM2.5 exposure (β = 0.931; 95% CI, 0.157-1.705) and long-term PM10 exposure (β = 0.378; 95% CI, 0.022-0.735) were both associated with elevated diastolic BP. There was no statistically significant association between diastolic BP values and short-term exposure to PM2.5 (β = 0.107; 95% CI, –1.036 to 0.823) or PM10 (β = 0.215; 95% CI, –0.07 to 0.5).
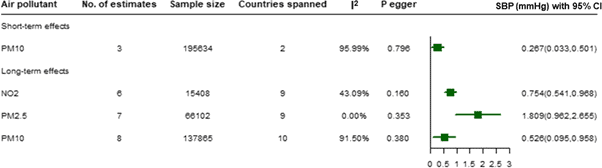
Figure 1: The I2 statistic was used to evaluate study heterogeneity and Egger regression was used to detect publication bias. PM10 indicates particulate matter with diameter ≤10 μm; PM2.5, particulate matter with diameter ≤2.5 μm; and SBP, systolic blood pressure.
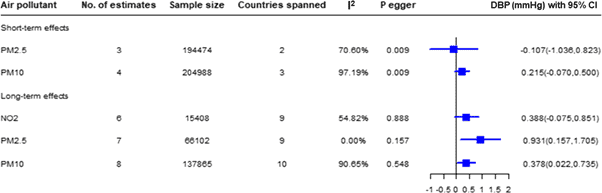
Figure 2: The I2 statistic was used to evaluate study heterogeneity and Egger regression was used to detect publication bias. DBP indicates diastolic blood pressure; PM10, particulate matter with diameter ≤10 μm; and PM2.5, particulate matter with diameter ≤2.5 μm.
More here: https://www.ahajournals.org/doi/epub/10.1161/JAHA.120.017734
Huang, M., Chen, J., Yang, Y., Yuan, H., Huang, Z. and Lu, Y., 2021. Effects of ambient air pollution on blood pressure among children and adolescents: a systematic review and meta‐analysis. Journal of the American Heart Association, 10, p.e017734.